ILGISA Web App Gallery
The purpose of this gallery is to highlight the work of GIS professionals & students across the State of Illinois.
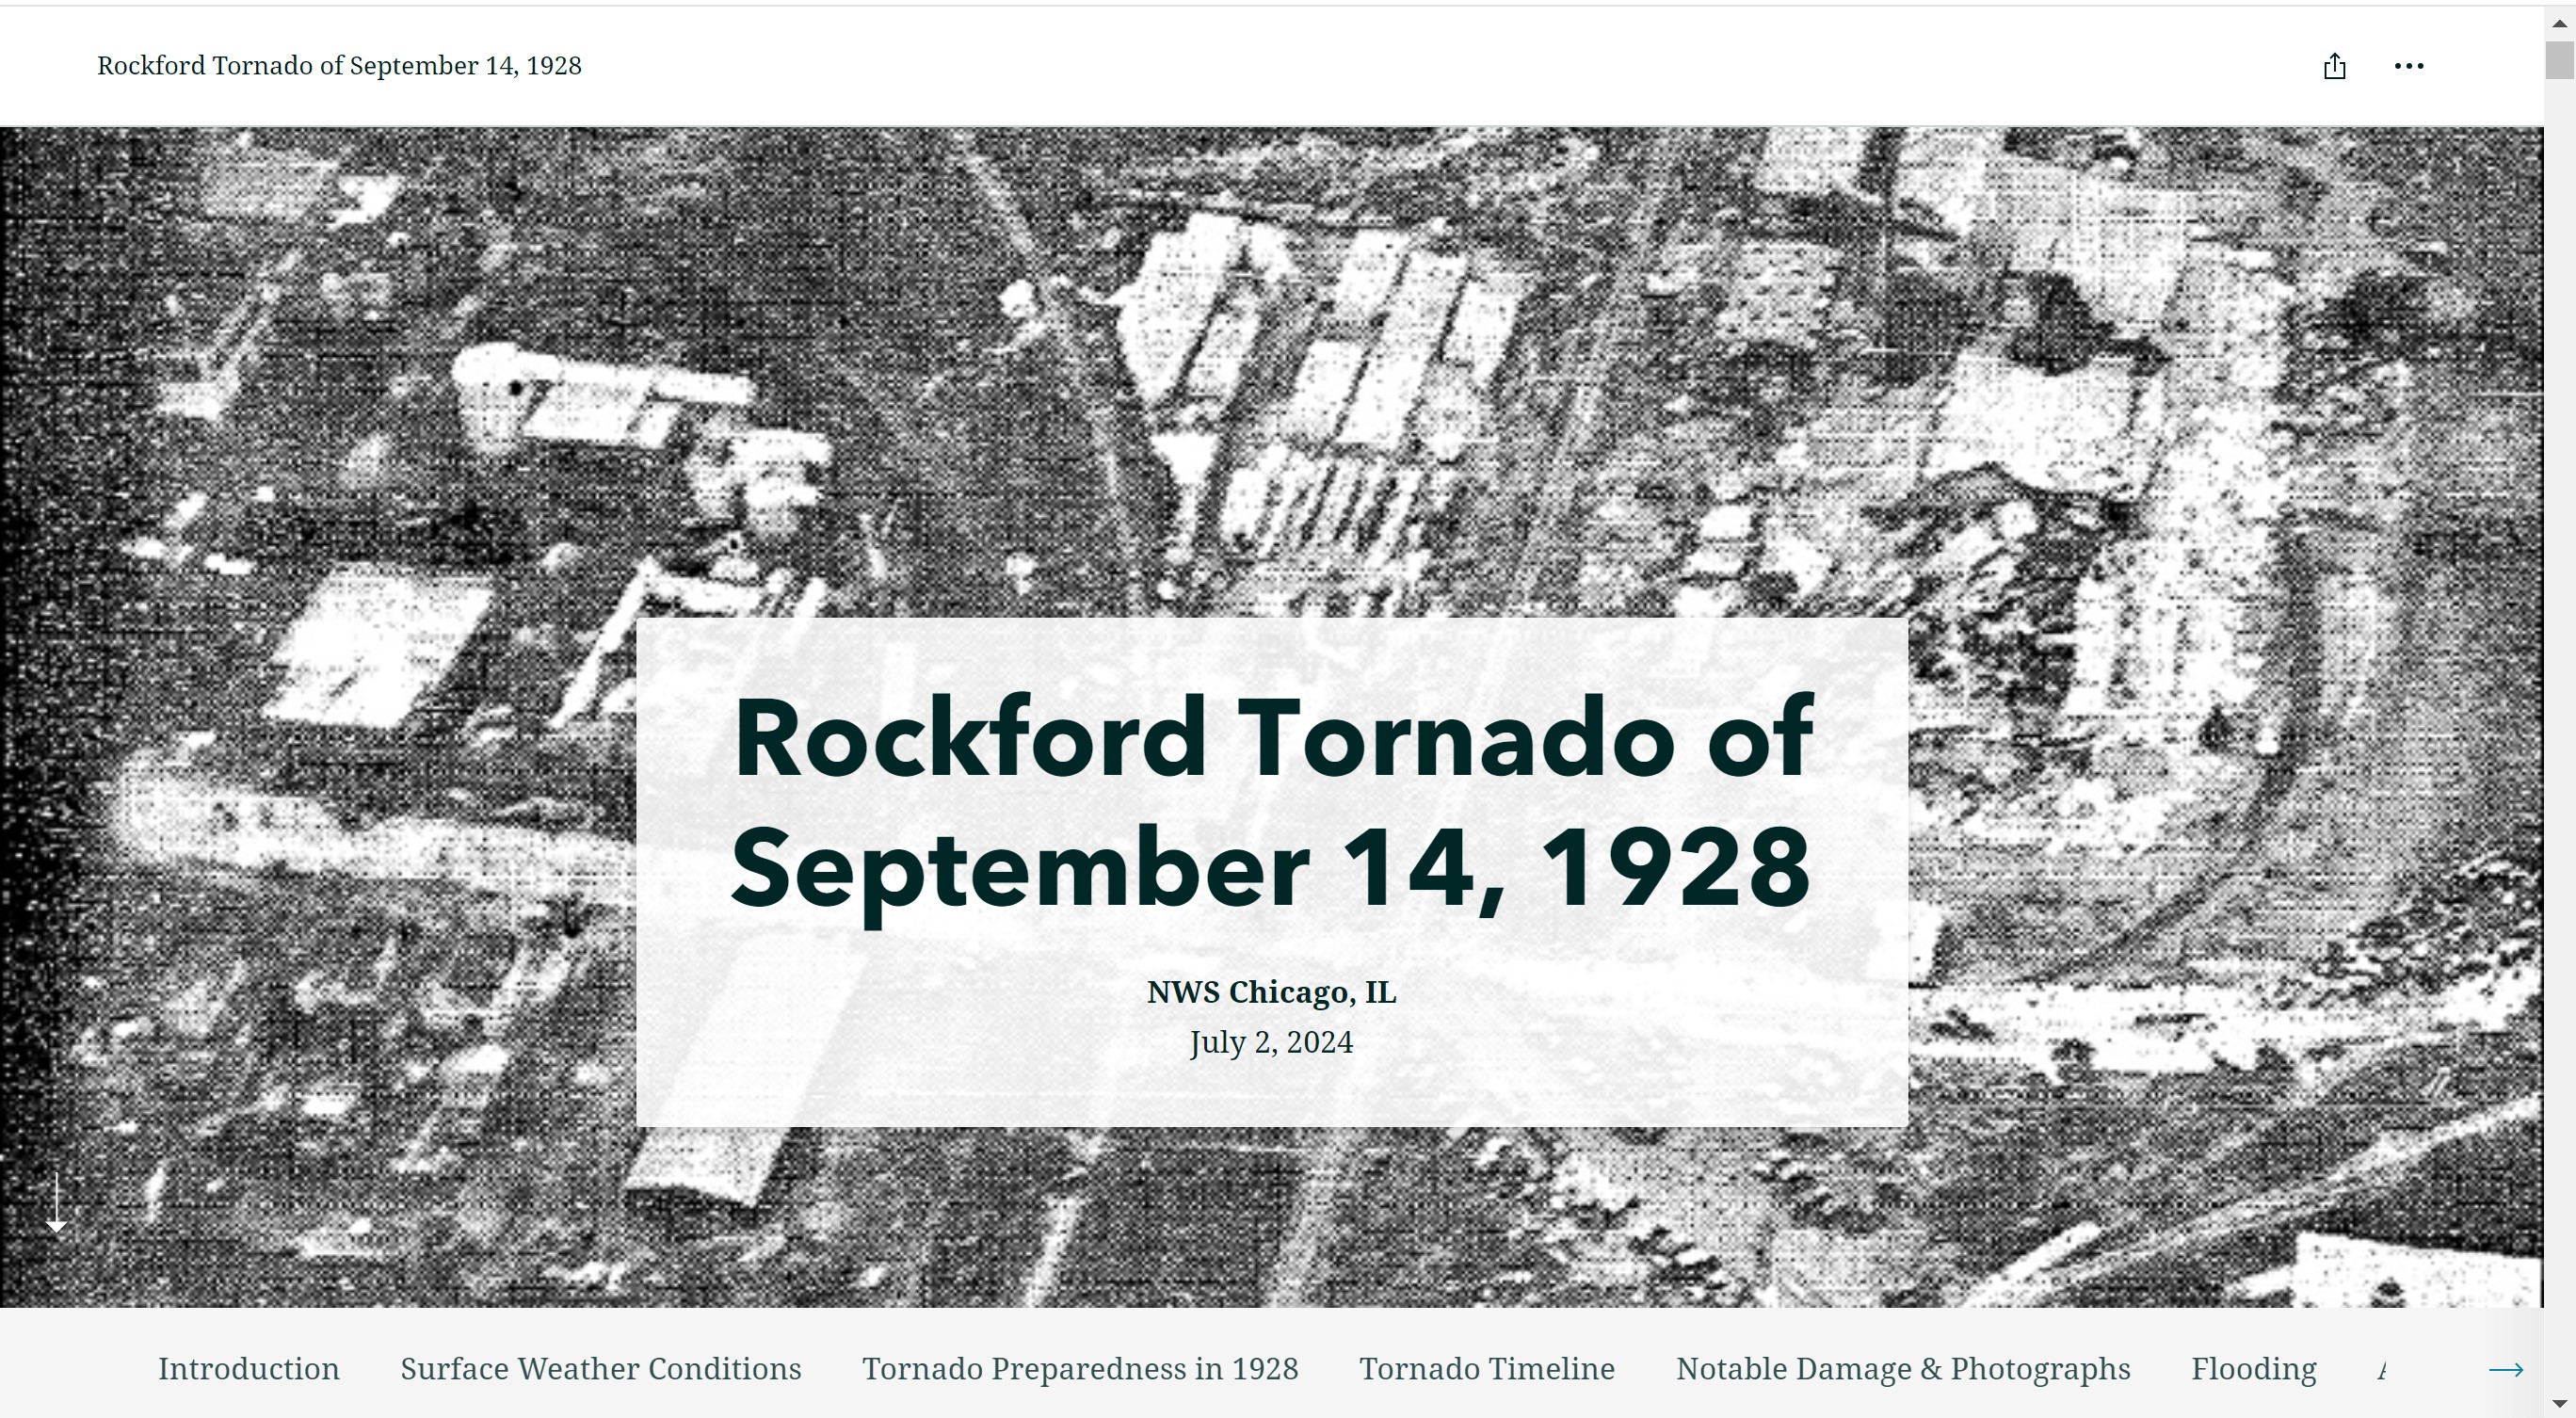
A story map was created to summarize an effort by the National Weather Service (NWS) Chicago office to reanalyze a tornado that impacted the Rockford, Illinois, area on September 14, 1928. This tornado killed 14 persons, injured at least 100, and caused an estimated $2 million in damages, equivalent to $36 million in 2024. NWS Chicago worked with the Rockford Public Library and the Rockford Midway Village Museum to acquire archived newspaper articles, maps, and photos. Handwritten paper weather observation forms scanned into the archives of the National Center for Environmental Information were reviewed and digitized. Weather data was used to create detailed surface weather maps of the conditions leading to the tornado. Photos and newspaper articles were reviewed to determine specific damage locations and damage severity, which was then mapped along the tornado's course through Winnebago, Boone, and McHenry counties. This reanalysis is believed to be the most detailed depiction of the tornado event to date.
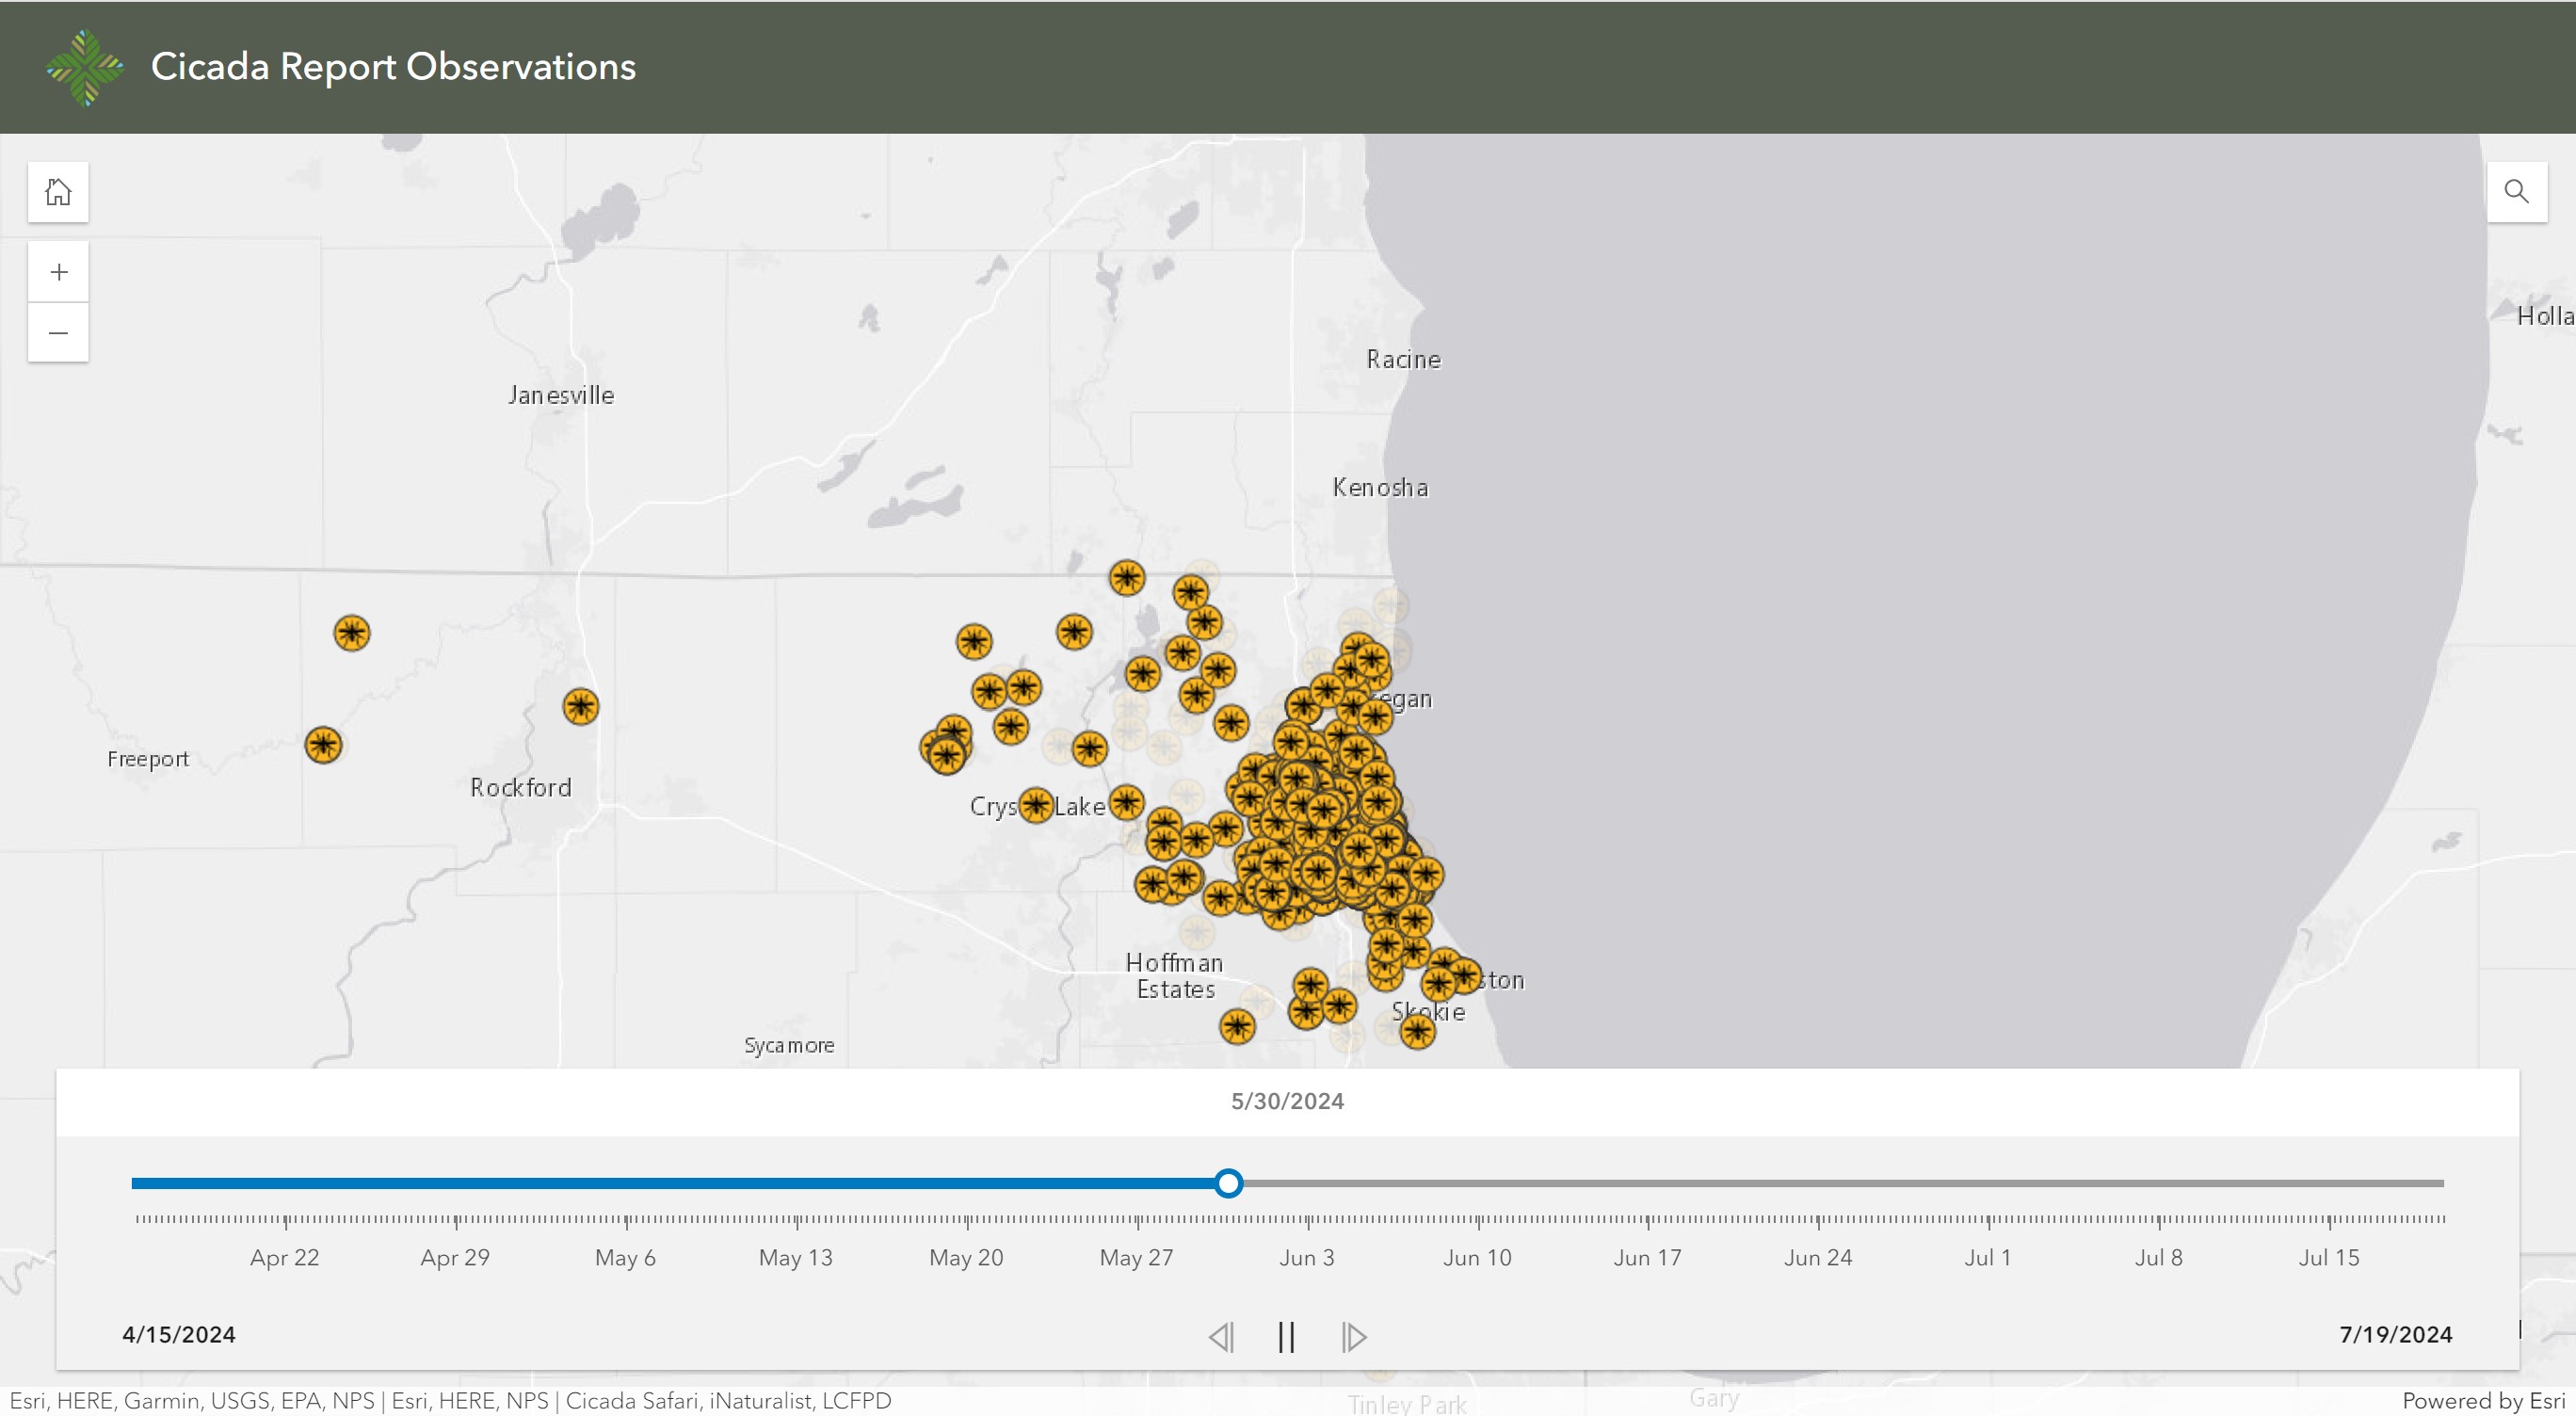
Cicada Report Observations
Submitted by: Nick Spittlemeister, Lake County Forest Preserves
The Lake County Forest Preserves created this time lapse web application using ArcGIS Instant Apps to visualize the timing of the emergence of the Periodical Cicadas this past spring and summer. The application visualizes a total of 3,500 cicada reports that were collected by using a public Survey123 form and cicada observations scraped from Cicada Safari and iNaturalist apps.
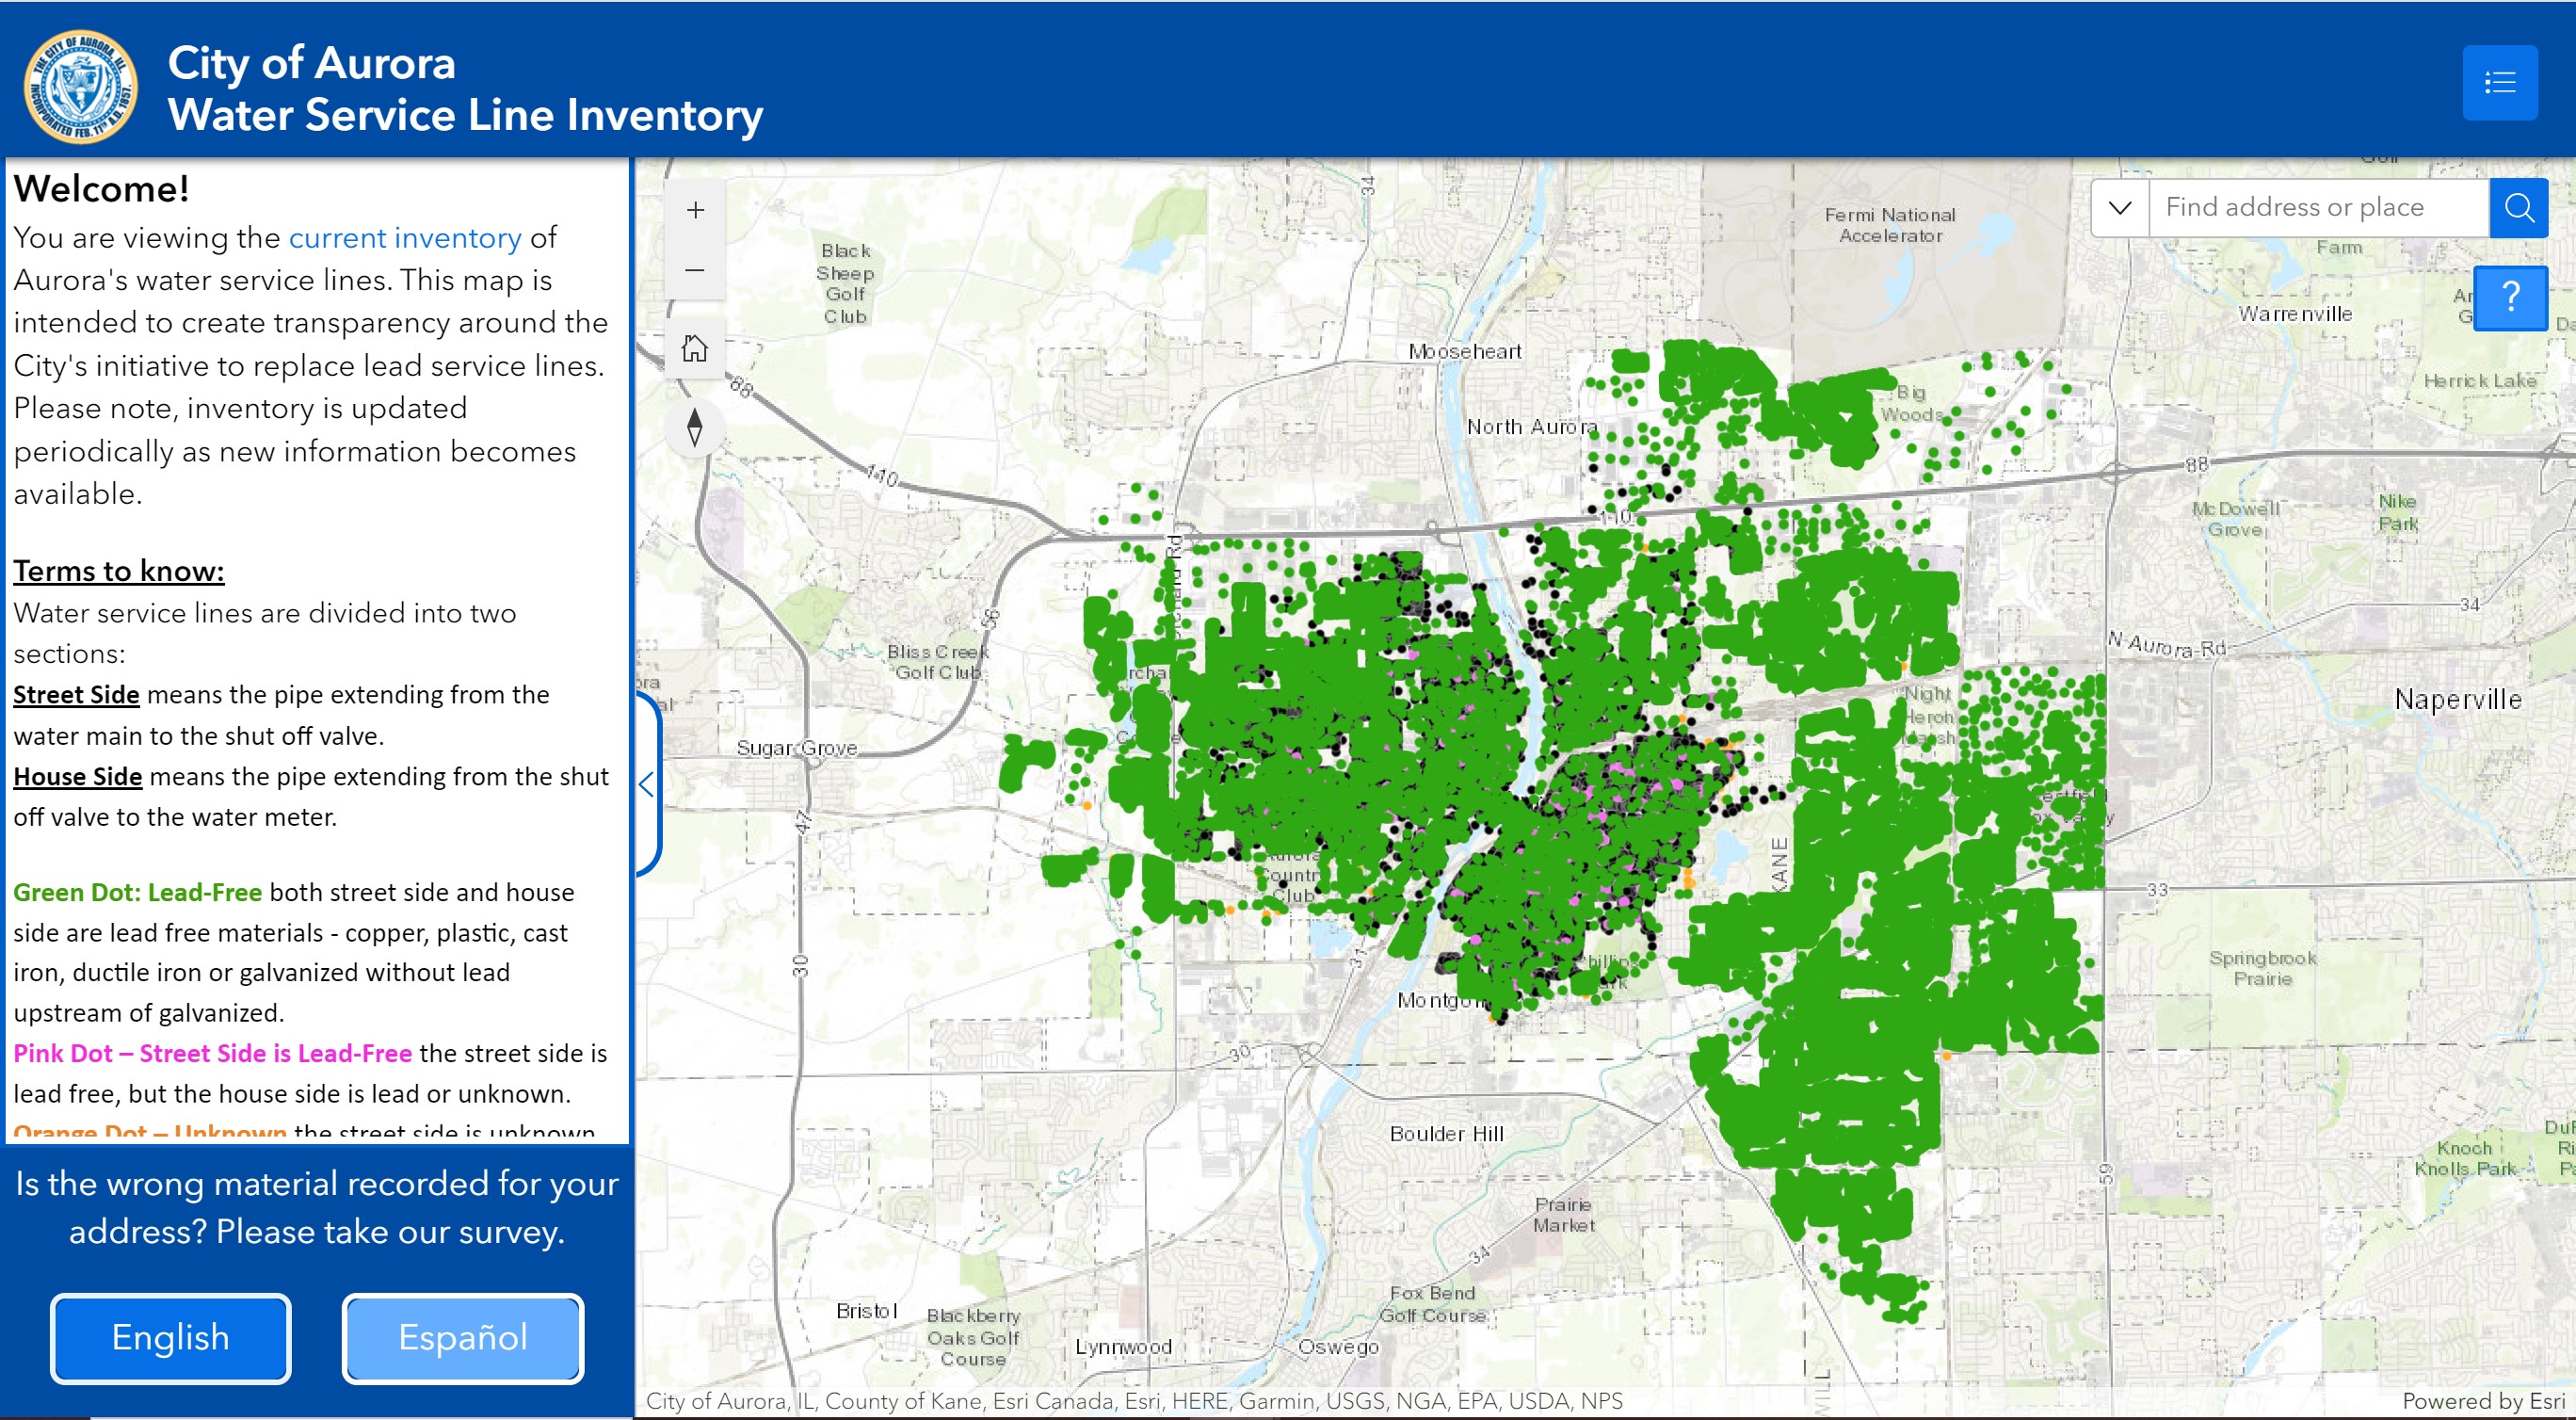
This app is intended to create transparency with the community around the City of Aurora's initiative to replace lead service lines. Residents can search for their address and view the material of their street side and house side lines. If the material is incorrect, residents are provided the option to send in information through the linked survey, which is available in English and Spanish.
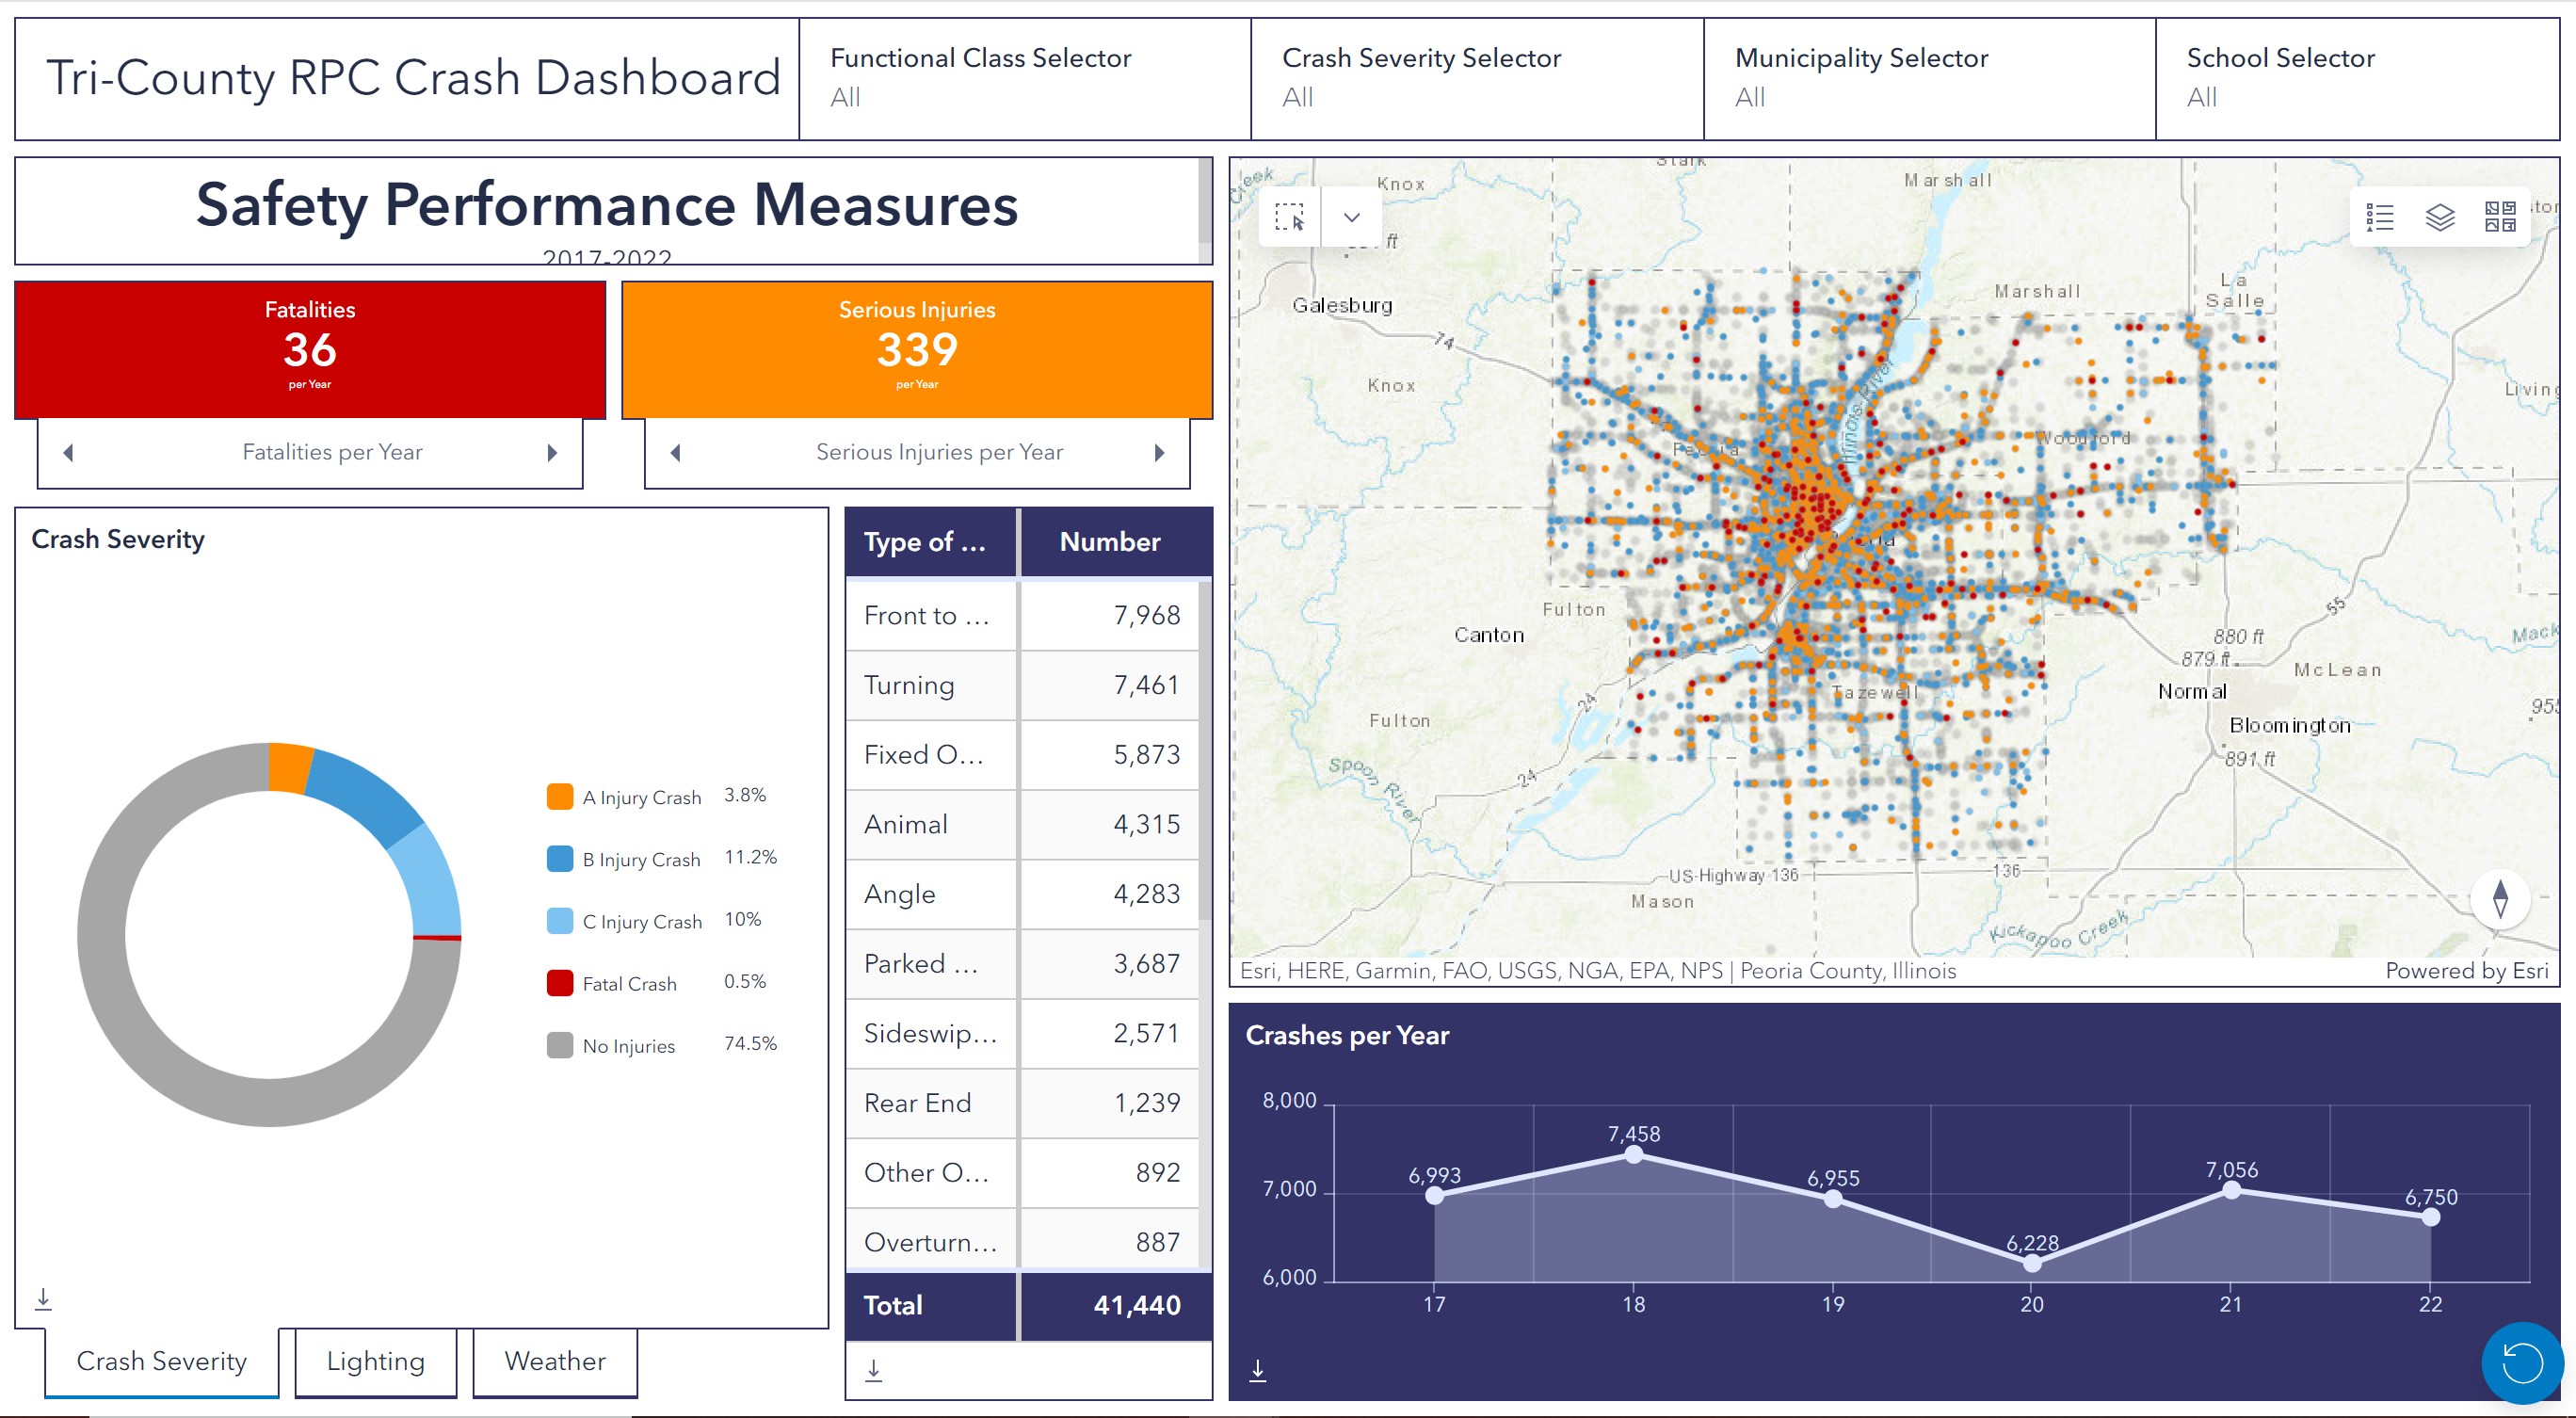
The dashboard is used by the project team, stakeholders, and the public to view and analyze crash data throughout the Peoria region (Peoria, Woodford, Tazewell Counties). Users can filter crashes by type, severity, road type, and city. Regional safety performance measures are also included.
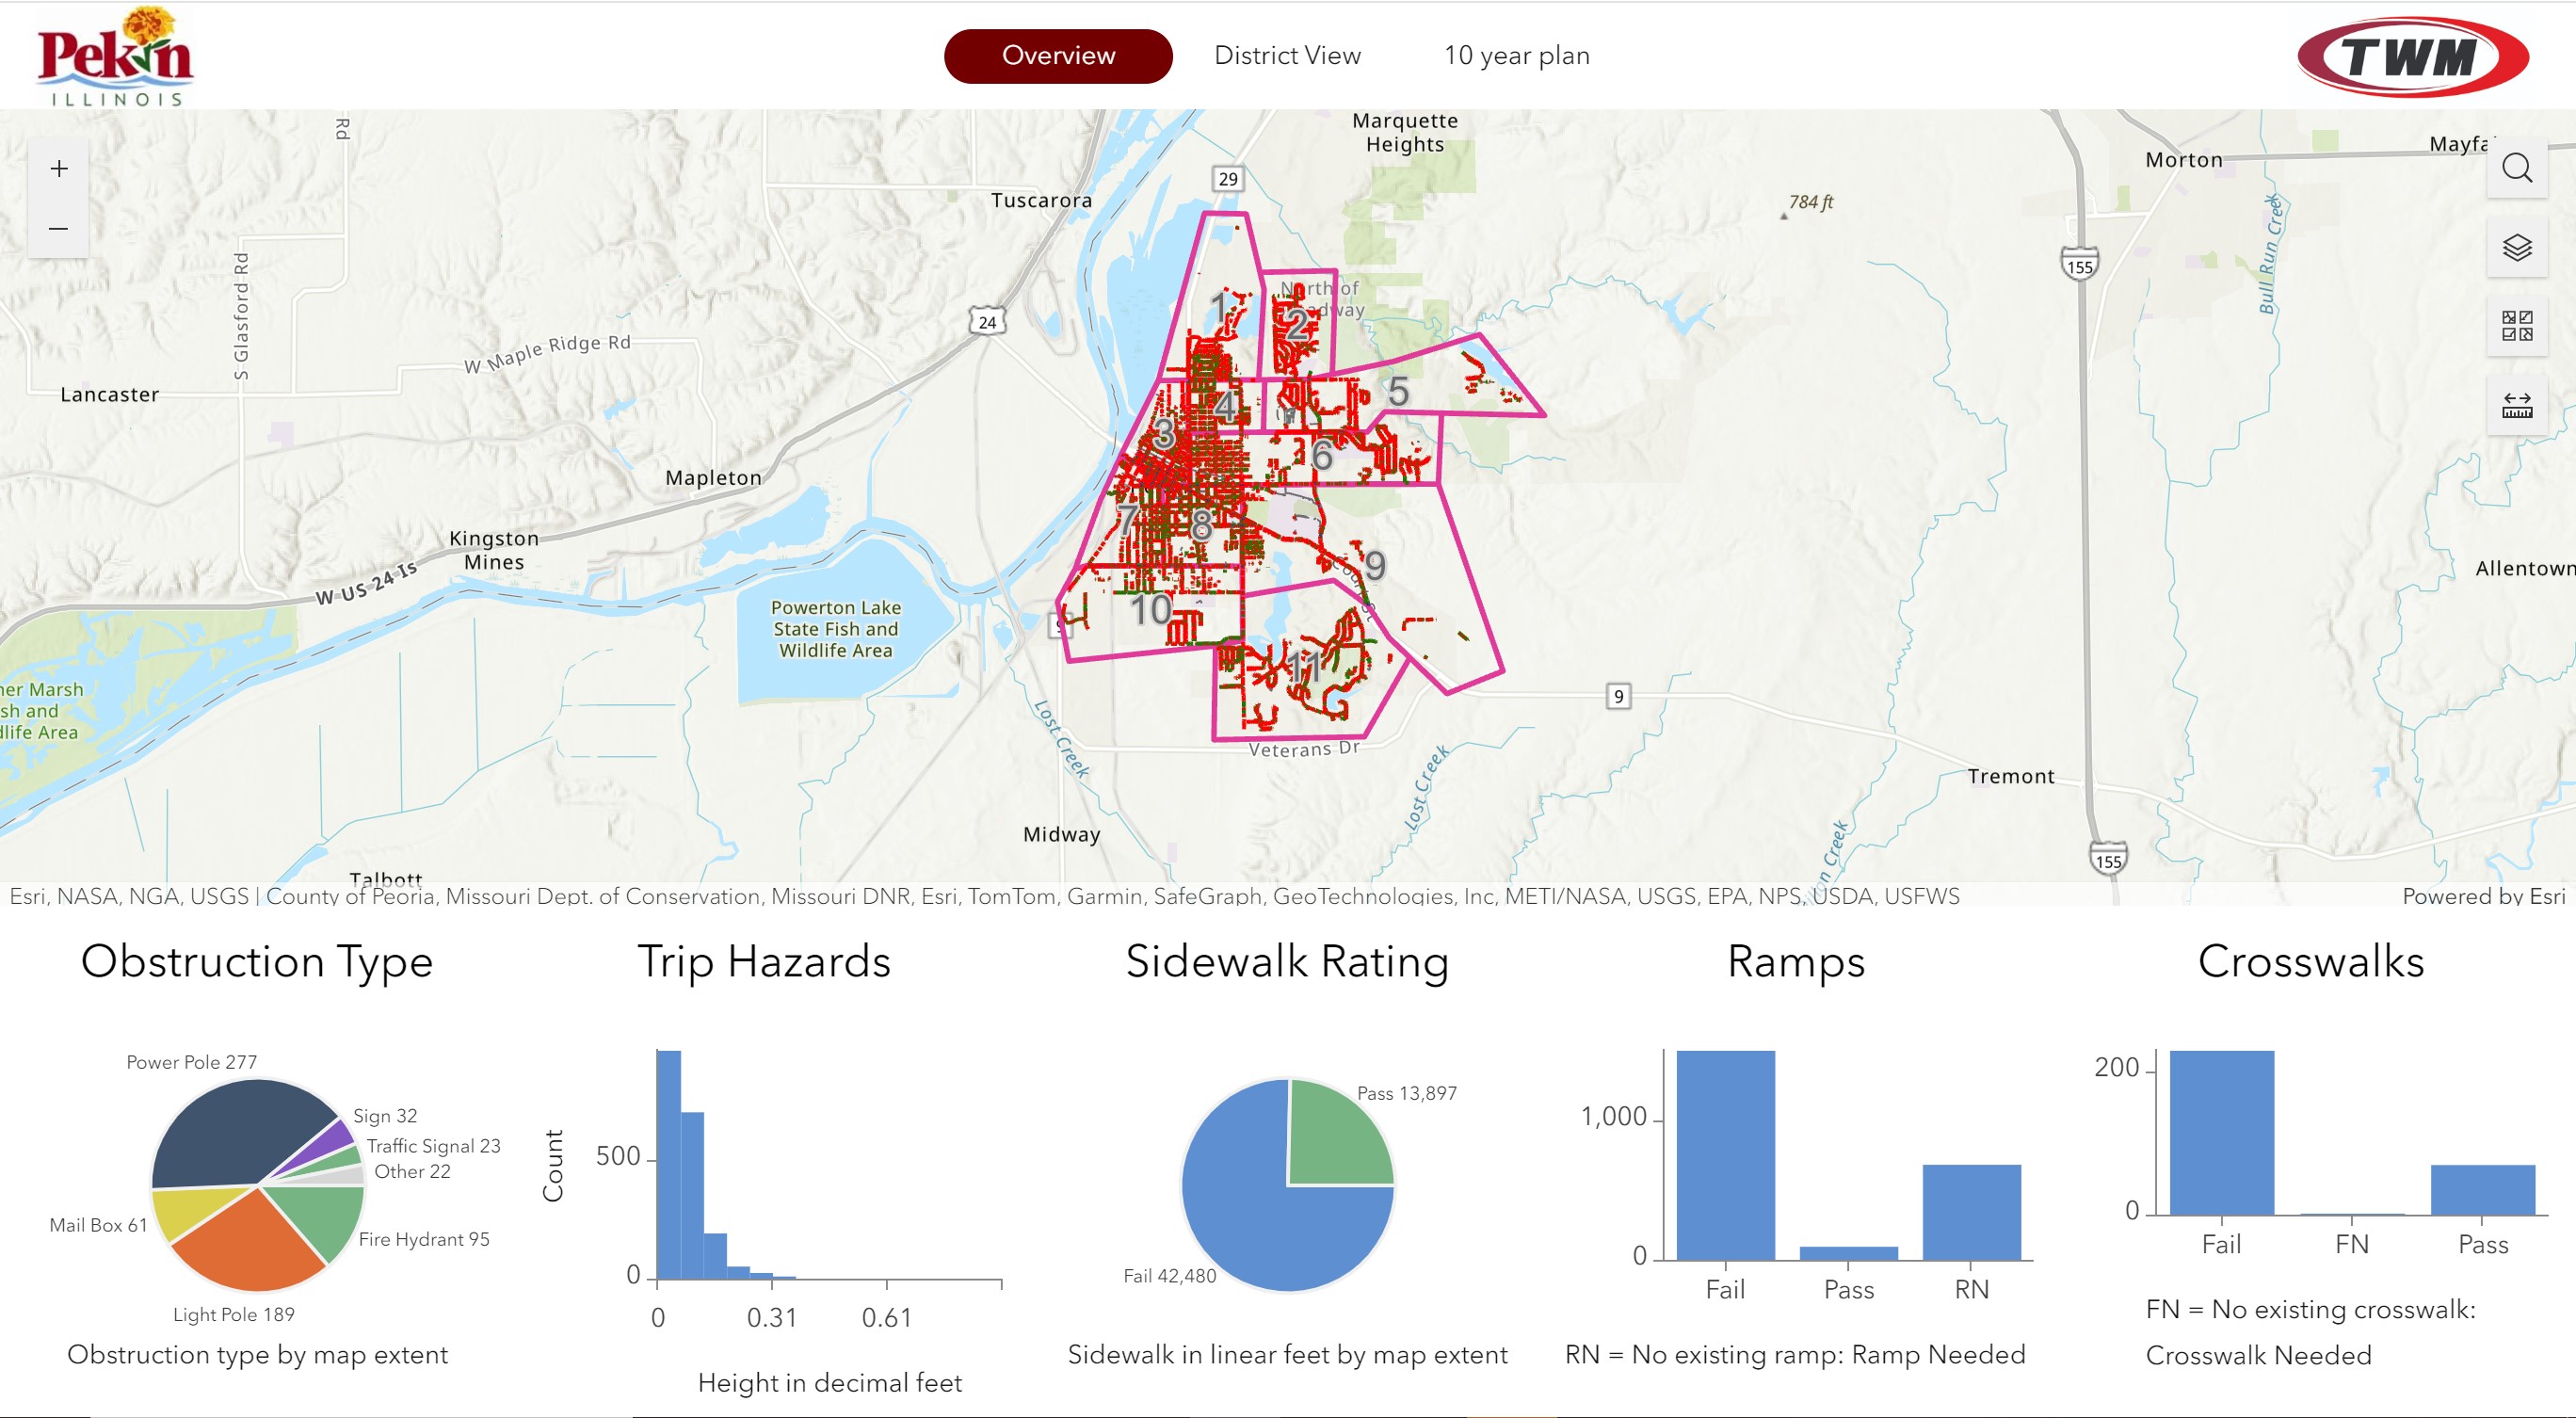
This Webapp was provided to our client for purposes of public engagement. In addition to a project overview view, It features additional views based on delineated districts as well as a 10 year capital improvement plan view. These views leverage Arcade expressions, layer masking, dynamic queries, using Web App Builder developer editions. Widgets update various counts & statistics for features based on filters or zoom. This provides an easy to visualize inventory of the City of Pekin’s ADA compliance and reporting for sidewalks, and was the culmination of a 2+ year project with field surveying, lidar processing, feature extraction, and GIS analysis.

CookViewer3
Submitted by: Cook County Bureau of Technology GIS Division
Cook County released CookViewer 3 in September of 2024. CookViewer is the premier property information tool for internal and external users. The application is a commitment to user-centric design, incorporating feedback from internal and external users. The newest version includes Spanish language translation, improved mobile experience, and enhancements across the features and functionality of the application.
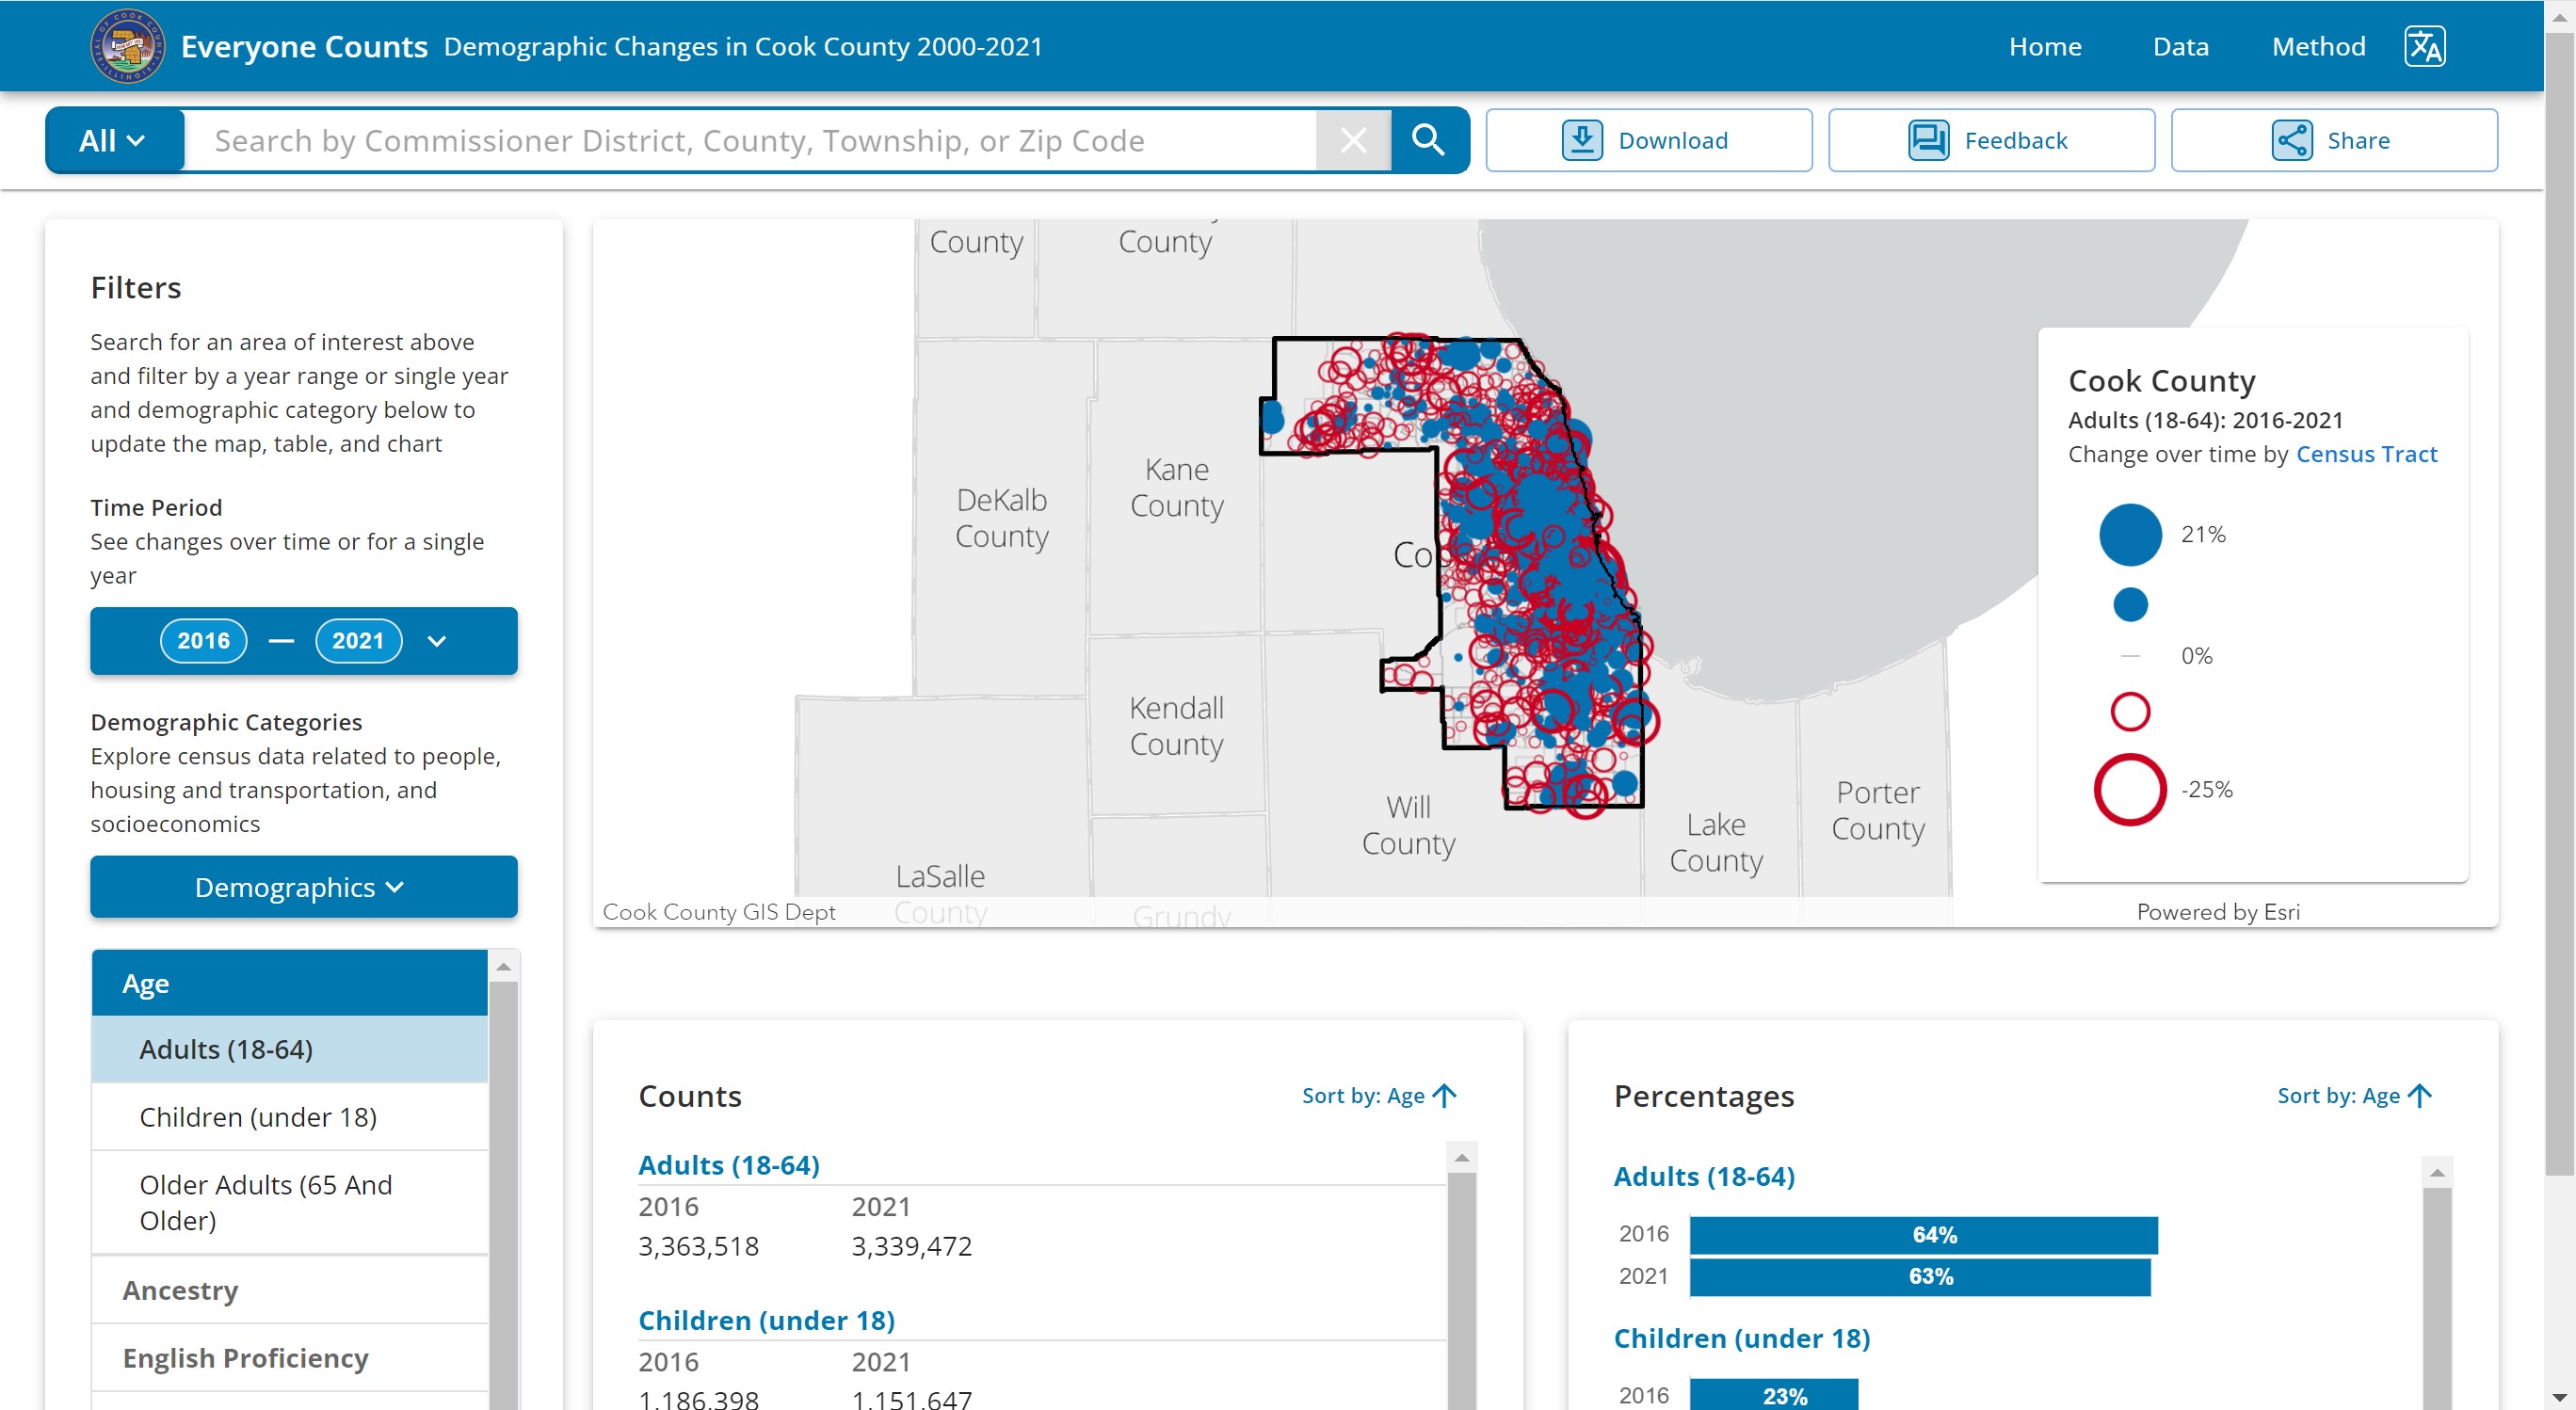
Everyone Counts
Submitted by: Cook County Bureau of Technology GIS Division
Everyone Counts is a census aggregation and visualization tool for Cook County. At the time of this submission, the application allows users to see a range of demographic, socioeconomic, and housing and transportation change from 2000 to 2021 utilizing data from the U.S. Census Bureau. The application provides filtering and data exports to a .csv format. This gives users on-demand census data for the County, Commissioner Districts, Townships, and Zip Codes.
|